Metrics and Reporting in GraphOS
Understand your supergraph's usage and performance
GraphOS Studio offers a performant and intuitive UI to help you monitor and understand your supergraph's usage and performance.
Metrics collection and forwarding
To analyze operation metrics in GraphOS Studio, you must first report them to GraphOS. If you have a cloud supergraph, its router automatically reports operation metrics.
If you have a self-hosted supergraph, you need to connect your router to GraphOS to report metrics. The reporting mechanism is the same if you use Apollo Server without the router. If you're using a third-party server, you need to set up a reporting agent.
Apollo also offers a Datadog integration to forward your graph's performance metrics to your Datadog account.
The following require an Enterprise plan:
- Connecting a self-hosted router to GraphOS
- Forwarding metrics to Datadog
Reporting metrics from Apollo Server or a monograph requires an Enterprise or legacy Team plan.
Insights and analysis
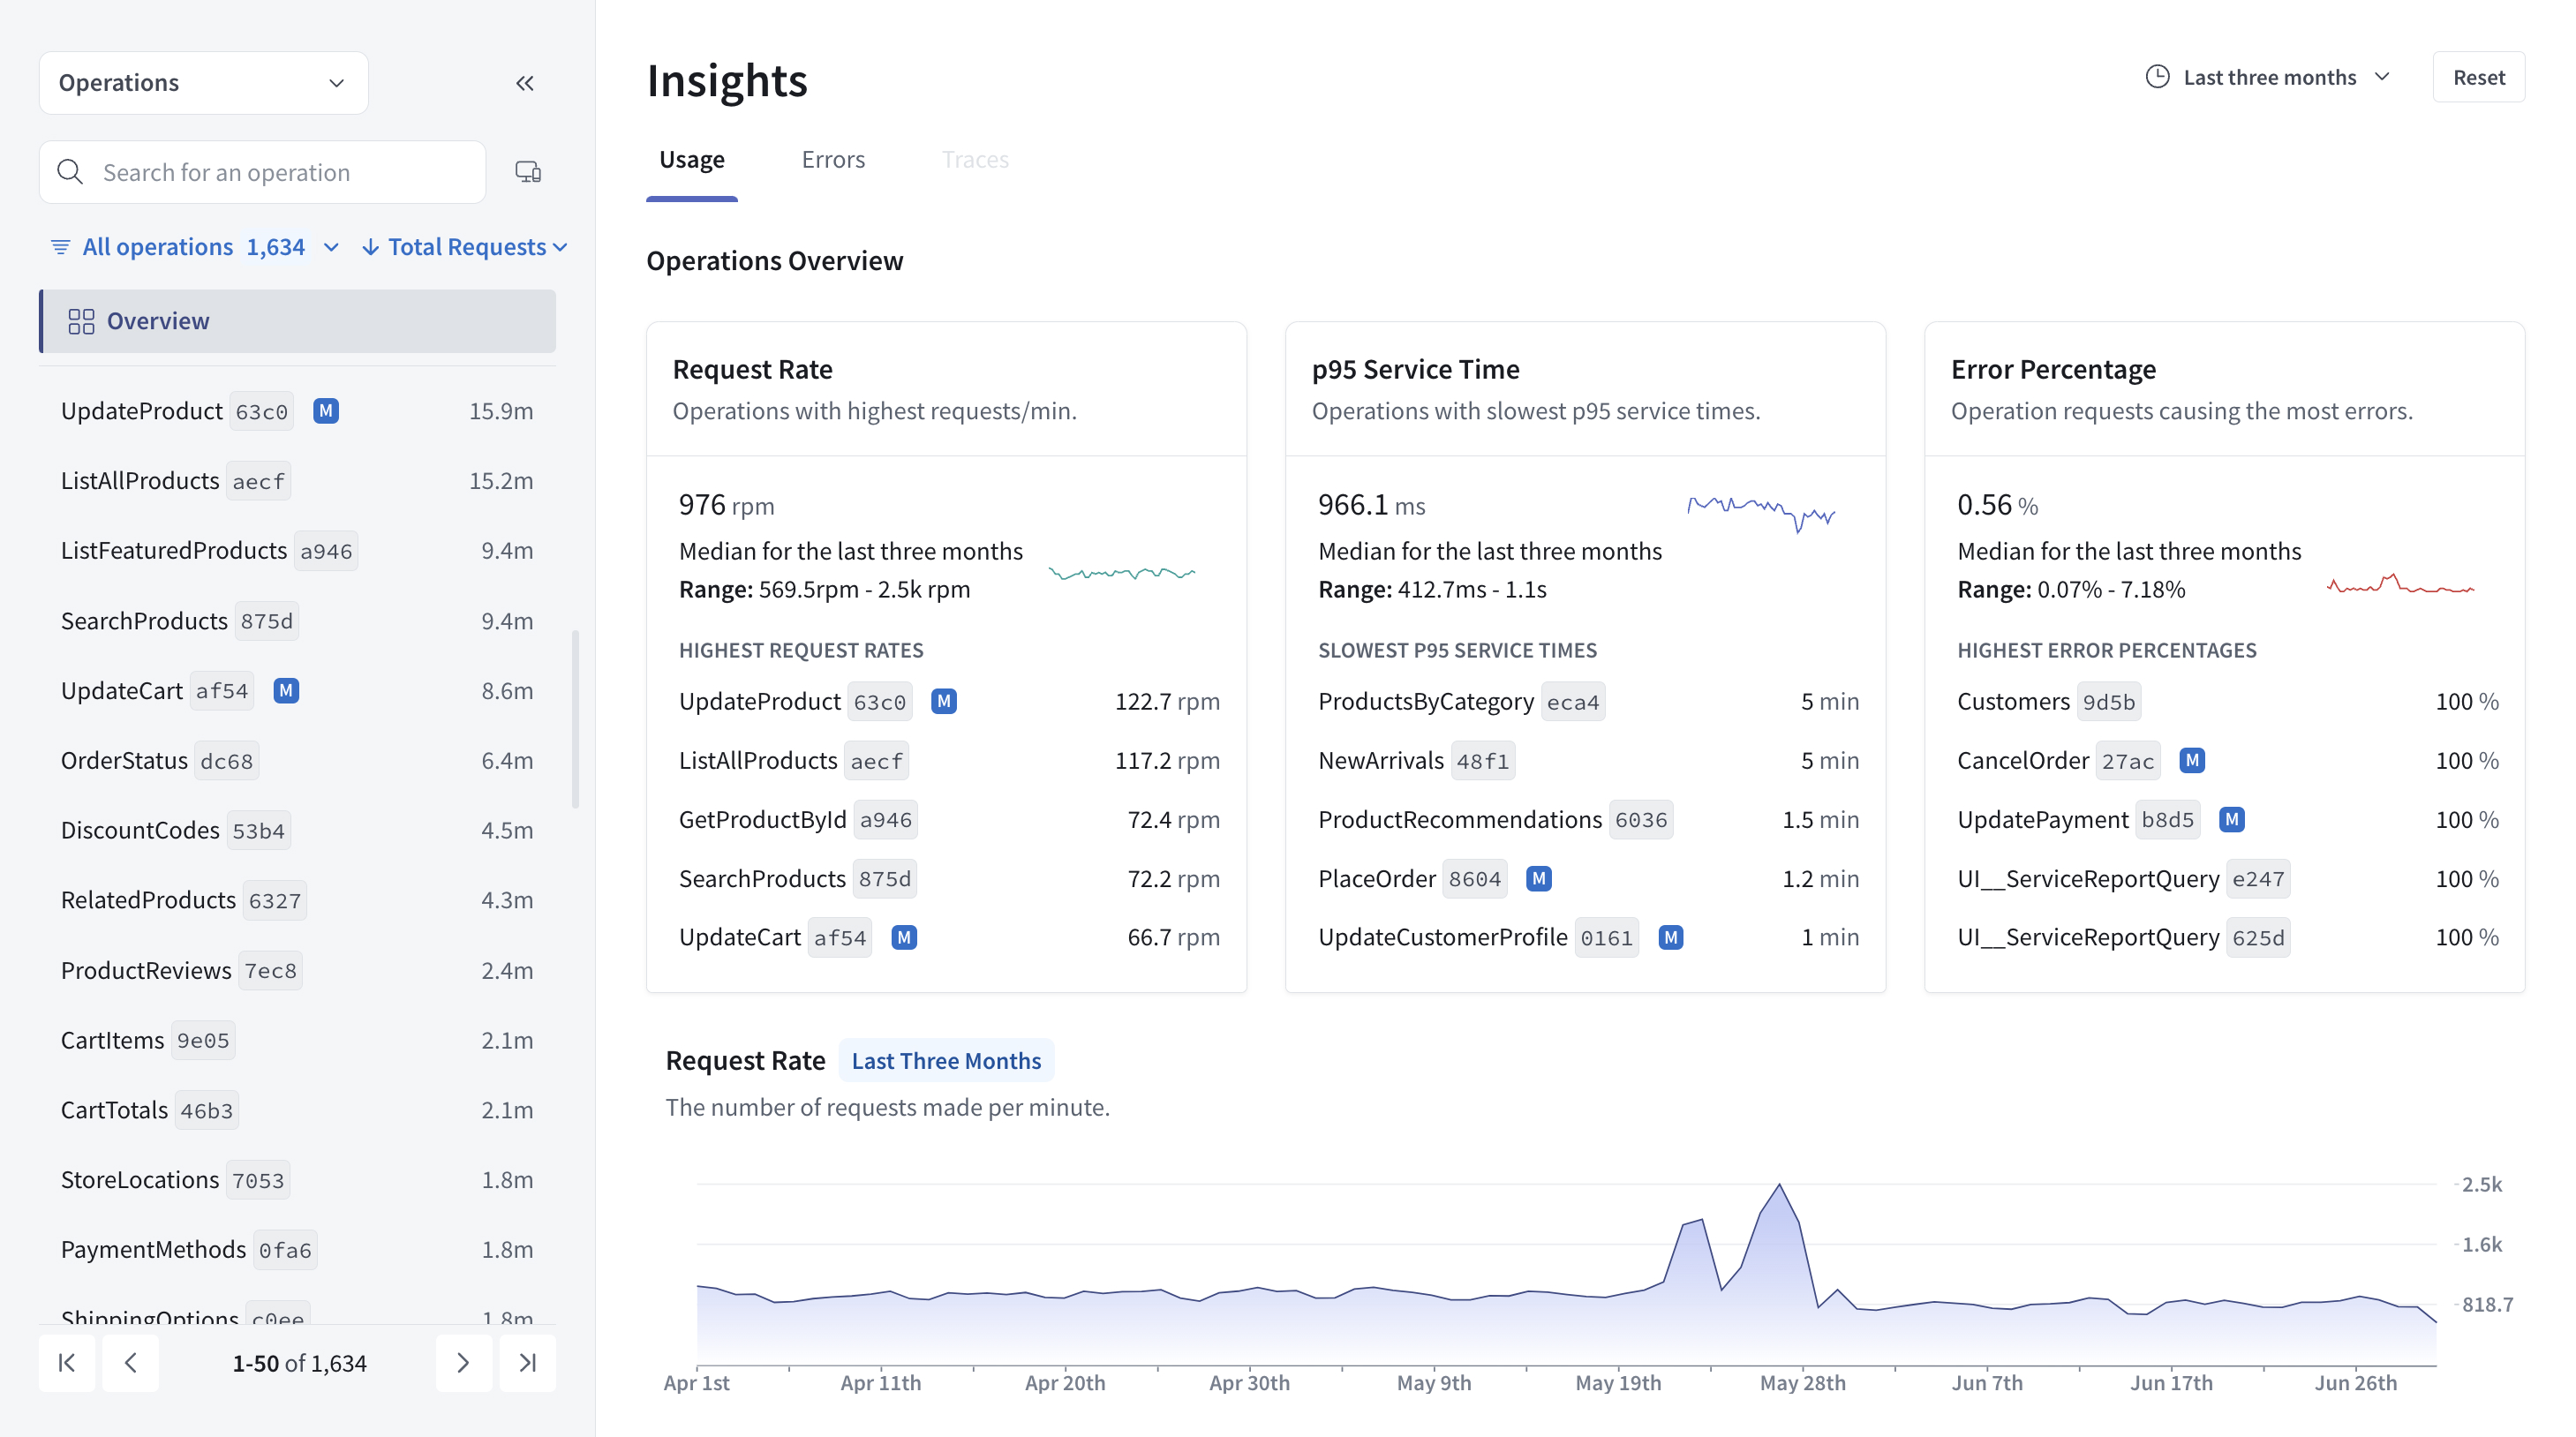
Once you've configured your graph to send operation and field metrics to GraphOS, you can examine them from any variant's Insights page:

The Insights page offers:
- A collapsible left sidebar that acts as a paginated index of your graph's operations and fields, where you can search, filter, and sort operations and fields
- An operations overview where you can adjust the overview's timeframe and filter it to specific clients
- Individual and overall operations performance metrics, including request rate and latency
- Resolver-level traces, if you've configured them
- Field usage metrics
Refer to the Operations metrics and Field usage pages to learn more about these metrics and how you can use them to optimize your graph's performance.
Notifications and alerts
Beyond actively monitoring the Insights page, you can also configure GraphOS to notify your team about changes to your graph and its performance. Check out Setting up GraphOS notifications to learn more.